Activity provided by Dr. Tabitha Wood
Experiment
Try to determine the things that might influence the outcome that you intend to measure, before you start. These are variables. In each experiment, change one variable (called the independent variable) and see how it affects some type of observable data (dependent variable). Keep all the other variables from changing by making them constant. Often this involves building an apparatus to hold the experiment.
Qualitative experiment: descriptive data is collected.
Quantitative experiment: numerical data is collected.
Some experiments are driven by collecting data and looking for patterns between the effects of variables upon data. Other experiments are driven by an educated guess of what the pattern in the data will be, called a hypothesis. Try to include in your experiment a positive control and a negative control, if possible.
These experiments help to identify more variables to control and confirm that your experiment design works. Usually, more variables are discovered during the first experiment, so you have to go back and design a new way to run the experiment so that the newly discovered variables are controlled. Keep improving the experiment until you’ve identified as many variables as possible and found a way to control them.
Example
- Variables in our experiment include:
- Depth of paper submerged in water
- Temperature of water
- Pressure on water
- Distance of ink spot on paper above water level
- Type of marker
- Type of paper
- Amount of ink on paper
- Solutes in water
- Qualitative experiment: What colours will coffee filter paper separate the green marker spot into?
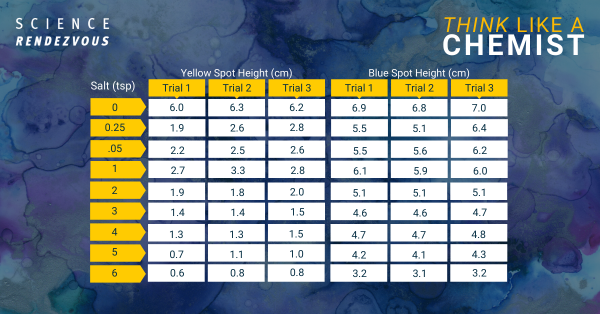
- Quantitative experiment: What is the effect of the concentration of salt in the water on the distance between the separated spots from a green ink spot?
- Independent variable: concentration of salt in water
- Achieved by: dissolving a known amount of salt (volume in teaspoons) to a known amount of water (volume in cups)
- Important information: limit of solubility for salt in water is 2 tbsp of salt in 100 mL of water
- Dependent variable: distance between the separated spots
- Numerical data collected by: measure distance between the center of the yellow spot and the blue spot using a ruler
Experiment Steps
Control variables: many of the variables are controlled by running the experiments at the same time using an apparatus
- Depth of paper submerged in water: build apparatus to hold all papers the same height in the water
- Distance of ink spot on paper above water level: draw spot at a measured location, using ruler
- Water temperature: run experiment in temperature controlled environment (indoors) and let water reach room temperature
- Pressure: run experiments on same day so that atmosphericpressure is the same
- Type of marker: use one marker (for example, a green Dollarama marker)
- Amount of ink on paper: be consistent with time marker is in contact with paper, pressure applied to marker
- Type of paper: use one type of filter paper (No Name basket coffee filter, ironed and cut into strips 3 cm x 10 cm)
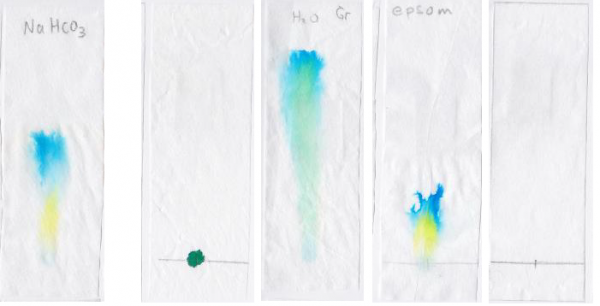
Positive control: One trial run with 1 tsp baking soda dissolved in water, instead of salt water
Negative control:
- One trial run with no water
- One trial run with no salt in water
- One trial run with epsom salt in water
- One trial run with no marker ink on paper
Hypothesis
Increased concentration of salt in water will result in greater separation between yellow and blue spots formed from green marker ink on filter paper.
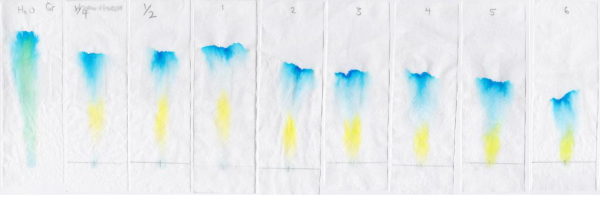
Apparatus
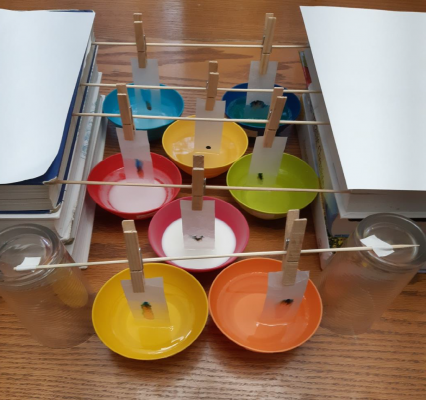
Photo by Dr. Tabitha Wood
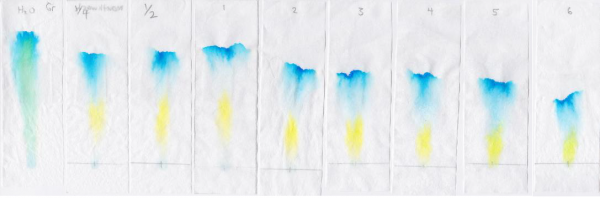
Experiment Results
Analyze
Once the data from the experiment has been collected, examine it to determine whether there was an effect, and if so, what the trend of the effect is. The data must be evaluated to determine whether it is accurate.
- Can it be repeated?
- Is it valid?
- Is it precise?
- Is it accurate?
Often, this involves analyzing the numbers collected from the repeated experiments.
- Analyze quantitative results as independent versus dependent variable data.
- Develop an equation and draw a graph to express the numerical relationship between the independent (x) and dependent variables (y).
- Do you accept or reject your hypothesis?
- Have you made any assumptions? Challenge them and see if your interpretation of the data changes.
You must trust the data over your own personal beliefs. Be skeptical. Is there another way that the trend could be explained?
Correlation is not causation. Just because you find a trend in your data, doesn’t mean that your independent variable is causing the trend. Try to relate any trend in the dependent variable to a cause in the independent variable.
By this point you will probably want to improve upon your experiment design and run it again, looking at other variables, or correcting for insufficient controls.
Draw a conclusion. What can you confidently say that you’ve discovered?
Example
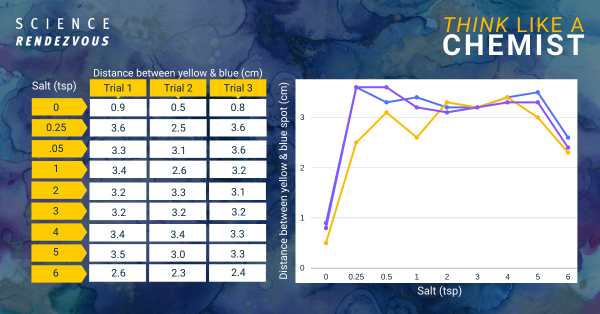
The increase in salt from no salt to ¼ tsp added to the water results in a greater separation between the blue and yellow spots in the green marker ink dye.
However, additional increase in salt above the addition of ¼ tsp doesn’t appear to increase the separation.
Can we show that there is a real effect using statistical analysis?
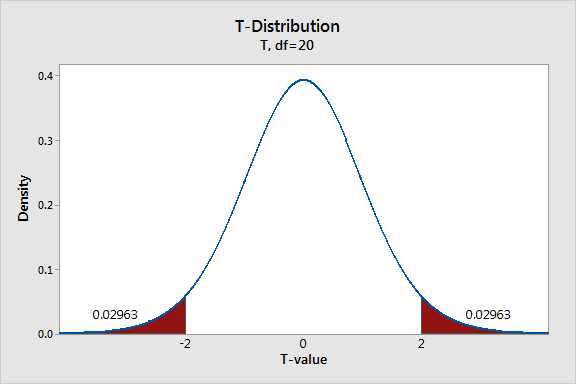
A t-test shows that the separation between the blue and yellow spots when the water is changed from having no salt to ¼ tsp salt is statistically significantly larger. The two-tailed P value is 0.0029, which means that it is very statistically significant.
A t-test shows that the separation between the blue and yellow spots when the amount of salt in the water is increased from ¼ tsp to ½ tsp is not statistically significant. The two-tailed P value is 0.81, which means that it is not statistically significantly different.
Is there a causative relationship between salt concentration and spot separation
Dissolved salt causes an increase in the ionic strength of the water. This can cause changes to the structures of the marker dye molecules when they are dissolved in this water. Changes in the chemical structure of the marker dye molecules will affect their partitioning between the filter
paper and the water. Increasing ionic strength of the water will decrease the solubility of the large organic maker dye molecules in the
water. Decreased solubility may affect the partitioning of the dye molecules between the filter paper and the water.
Any variable that affects the partitioning of the dye molecules between the filter paper and the water will result in changes to how far the dye molecules move during chromatography procedure. Therefore, it can be reasoned that salt concentration would have an effect upon the distance the yellow and blue spot separate.
Conclusion
Increasing salt concentration by dissolving ¼ tsp of salt in tap water results in greater separation between yellow and blue spots formed from green marker ink on filter paper. However, increasing salt concentration above ¼ tsp doesn’t continue to increase the separation.
Further experiments:
- Measure the ionic strength of the water at the salt
concentrations used in the experiment. - Test other solutes that affect ionic strength for a similar
effect upon spot separation.
Share
Can your discovery be applied to solve problems or create new technology?
Does your discovery advance our understanding of a phenomenon in our universe?
Sharing the discovery that you’ve made is important. Other people can use your discovery to advance other research, or to develop helpful new technology.
Negative results are results none the less.
Knowing about negative data helps shape future experiments. You must be ready to revise, or reject your conclusion when
you are presented with valid data that is contradictory.
Example
We created this series to let you know about our discovery. If it was sufficiently relevant, important, and accurate we would publish our results in a peer reviewed scientific journal. We think that you need to know about this because it’s a good example of how scientists think!
Here’s what we can do with this new information:
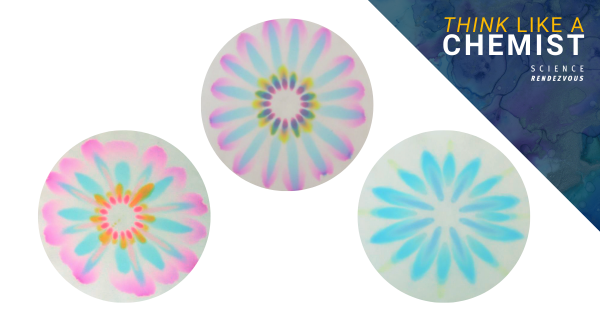
- Create colourful and creative “chromatography flower” crafts with the technique
- Controlling the amount of salt in the water will allow artists predict the outcome of their art techniques.
Hopefully the results of this experiment will give you ideas of other experiments to conduct. If somebody came to me and said, “It’s not the effect of dissolved salt on the ionic strength of the water that’s affecting the spot separation. I have valid data showing that the causative effect is the interaction of the salt with the paper,” I would have to consider what this new evidence means for my previous conclusion.
Maybe time to run more experiments! And so it goes…